Since the very beginning of humanity, we’ve relied on water for our daily lives. In fact, 60% of our whole body is water!
Settlements throughout history have always developed around fresh water sources and Medieval Bristol was no different with early wells dug down in Castle Park and Wine Street (as they are now known).
Although our data on domestic water usage doesn’t track back all the way to 1846 when Bristol Water was founded (gutting, I know), we are lucky to have a whole wealth of information on how we’ve use water over the years in Bristol and our wider supply region. And this data is useful because it helps us understand our customers behaviour better. We use it for all sorts of things, from making sure we have the right infrastructure in the right areas to planning future resources like pipes, repairs and even the amount of water we need in our reservoirs.
Our Water Supply & Energy Team is made up of 5 people who work around the clock making sure that we have enough water running through our pipes and into your home. Much of their resource planning focuses on monitoring and management of water usage data. By understanding what we use as a region, by day, month, and season and plotting this against weather and external events, they can predict what might happen in the future. Part of that comes from knowing what’s gone before and finding trends and patterns in the data.
Past data and trends

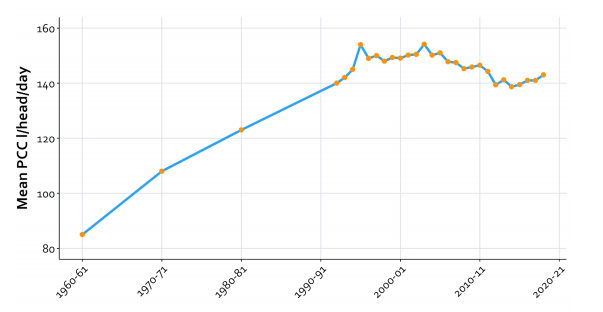
As you can see in this chart, from the 1960’s usage in our region grew steadily year on year until it peaked in the mid-1990s. This steady increase is down to a few things but most likely, post war infrastructure improvements and an increase in population in the city of Bristol. In 1960, we had a population of 589,000 and now, in 2020, its closer to 690,000 – that’s almost 100,000 extra more people living, working, eating, sleeping, and using water!
Between 1960 and 1990 we also did a huge amount of work on our business. bringing fresh water into many homes and to businesses and places it hadn’t existed before.
See that peak in 1990?
We had a very dry summer. A temperature of 37.1c was recorded not far from here in Cheltenham, the hottest known in the UK. What happens when the temperature goes up? Water usage does the same. Not unlike May and early June, people were using sprinklers on their lawns, filling their paddling pools and generally spending more time in and around water to help them cool off.
Despite a drought in 2010 -2011, since the 1990’s water usage did start to decline. This could be attributed to a range of factors, including the passing of the Water Industry Act which made it compulsory to install a water meter into all new build properties in the UK. A water meter allows customers to monitor their own water usage and here at Bristol Water, we find that our metered customers use, on average, 23% less than their unmetered counterparts.
Modern day usage
Despite all of this, since 2014, we’ve seen an increase in water usage again. Given that not too much has changed in terms of our infrastructure and our region’s population, what are those reasons? Time for some common sense and to look to the trends.
Household consumption is driven by factors including weather, property type, what water fittings are present (e.g. water meters) and even socio-demographics. For example, the number of students living in our region is estimated at over 40,000 with Bristol University reporting a sustained 7% growth in student numbers every year since 2012. Combine this fact with the boom in property building (particularly flats) since the recession ended in 2008 and the fact that dual flush toilet models found in new builds are prone to leaking. One small leak might not sound enough to sway the figures but throw 20,000 leaky loos each (invisibly) wasting up to 146,000 litres a year and perhaps we can see where that increase has come from.
Looking ahead
This year, with the pandemic meaning we’re all spending a lot more time at home, working, holidaying and socialising in one place, it’ll come as no surprise that our home water usage has spiked hugely. From big things like keeping the kids entertained with a new paddling pool to the small things like all those extra cups of tea – with 1.2 million customers in our area, the litres soon add up.
As we move forward in this ‘new normal’ with more time spent at home, it’s important that we all think about water usage and be savvy where we can to make sure we’re not wasting it. By all doing our bit, we can start to bring that graph back down again and ensure a lasting supply for future generations. Not sure where to start? Try these water saving tips and why not take a look at the water saving devices available through our partner Save Money, Save Water.
Let us know how you get on by sharing your photos on social media.


